

STM32CubeMonitor vs FreeMASTER vs MCUViewer: which live variable tool fits your project?
STM32CubeMonitor, FreeMASTER and MCUViewer all plot MCU variables live. How they differ in probes, MCUs, fast signals, tracing, dashboards and licensing.
All three tools do the same basic job: read variables out of a running microcontroller and show them on a plot, without stopping the core. Past that, they go in different directions. STM32CubeMonitor is ST’s tool for building dashboards on STM32. FreeMASTER is NXP’s run-time debugging and tuning tool for NXP parts. MCUViewer is an independent tool for debugging on practically any Cortex-M or RISC-V target.
A disclosure first: I make MCUViewer. I’ve described the other two the way their own documentation does, and I’ve tried to be clear about where each of them is the better choice. This is to addresses questions that often pop up when people discover MCUViewer.
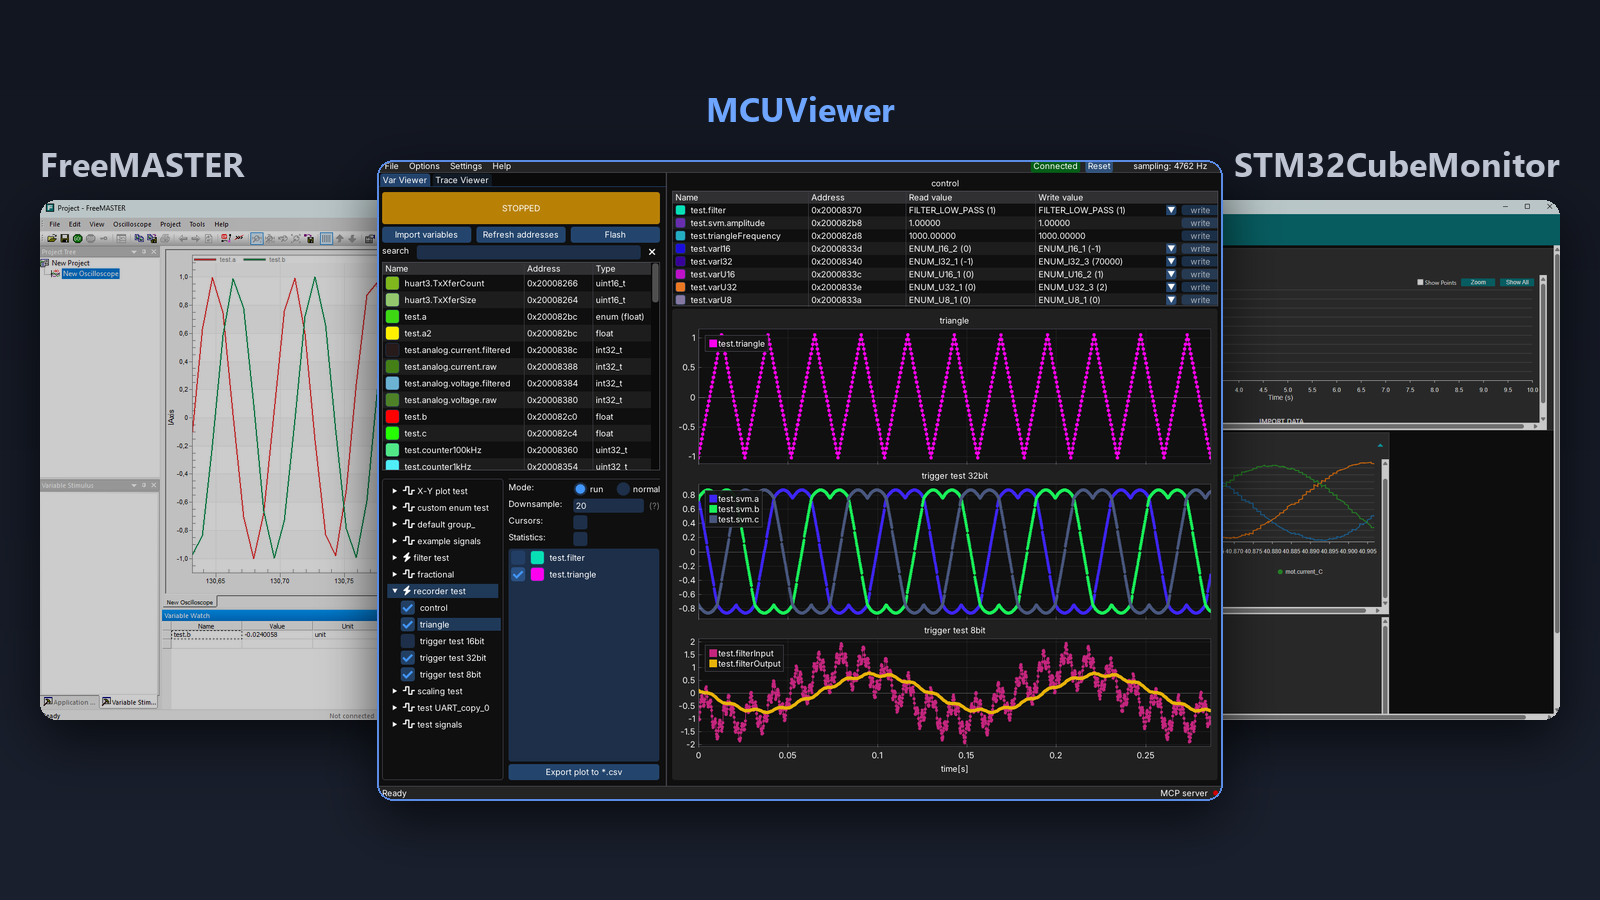
The short answer
- STM32CubeMonitor if you’re on STM32 and want a dashboard - gauges, buttons and charts for a test bench or a demo that someone else will use. Not suitable for a quick check or more indepth analysis.
- FreeMASTER if you’re on an NXP microcontroller and need to reach the target over CAN, Ethernet or a serial line. It’s free, but its license only allows it on NXP-based systems.
- MCUViewer if you’re debugging: measuring a control loop on the plot, timing interrupts over SWO, capturing signals faster than the debug link, or moving between differnt targets families with whatever probe you have. It’s free for evaluation and personal use, and paid for commercial use.
Side by side
| STM32CubeMonitor | FreeMASTER | MCUViewer | |
|---|---|---|---|
| Made by | STMicroelectronics | NXP | Independent |
| Price | Free | Free | Free for evaluation; €99 per seat per year or €256 perpetual for commercial use |
| Microcontrollers | STM32 | NXP only - required by the license | STM32, NXP, RP2040, MSPM0, any Cortex-M or RISC-V through a GDB server; TI C2000 and others over UART |
| Host OS | Windows, Linux, macOS | Windows; on Linux only the FreeMASTER Lite communication service | Windows, Linux, macOS |
| Connection | ST-LINK, J-Link | JTAG/SWD, UART, USB, CAN, TCP/IP, SEGGER RTT | ST-Link, J-Link, OpenOCD probes (CMSIS-DAP, Raspberry Pi Debug Probe), UART |
| Variables from | *.elf file | *.elf file, or TSA tables in the firmware | *.elf file |
| Firmware changes for live variables | None (direct mode) | None over a debug probe; a communication driver over any other link | None over a debug probe; a small driver over UART |
| Samples taken by the firmware | Snapshot mode, ST-LINK only | Recorder, needs the communication driver | Recorder, a small module called from an interrupt |
| SWO / ITM trace | - | - | Trace Viewer, with an ST-Link or J-Link |
| User interface | Node-RED flows and a web dashboard | Variable watch, oscilloscope and recorder views, HTML/JavaScript pages | Plots with cursors and statistics, variable table |
| Automation | Node-RED | JSON-RPC API for Python, Node.js, C#, MATLAB, Excel and others | MCP server for AI coding agents |
STM32CubeMonitor
STM32CubeMonitor is ST’s free monitoring tool, and the one ST points STM Studio users to now that STM Studio is no longer developed. It’s built on Node-RED: instead of opening a plot window, you wire up a flow - a variables node with the addresses imported from your *.elf file, an acquisition node for the probe, and chart, gauge or text widgets at the end. The result is a dashboard that runs in a browser and can also be opened from another PC, a tablet or a phone on the same network.
Acquisition runs in two modes. In direct mode, CubeMonitor reads the variables from RAM over SWD or JTAG at a rate set per variable node - presets from 0.1 Hz to 1 kHz, or a sequential loop that reads as fast as the link allows. It needs no code changes, but variables read one after another aren’t guaranteed to come from the same instant. Snapshot mode fixes that: the firmware, instrumented with ST’s DataAcq files, takes the samples itself and CubeMonitor empties the buffer. It’s more accurate, more intrusive and only works with an ST-LINK. Since version 1.8 a J-Link can be used as well, through dedicated nodes. Logging to a file with replay, triggers and several probes at once are built in.
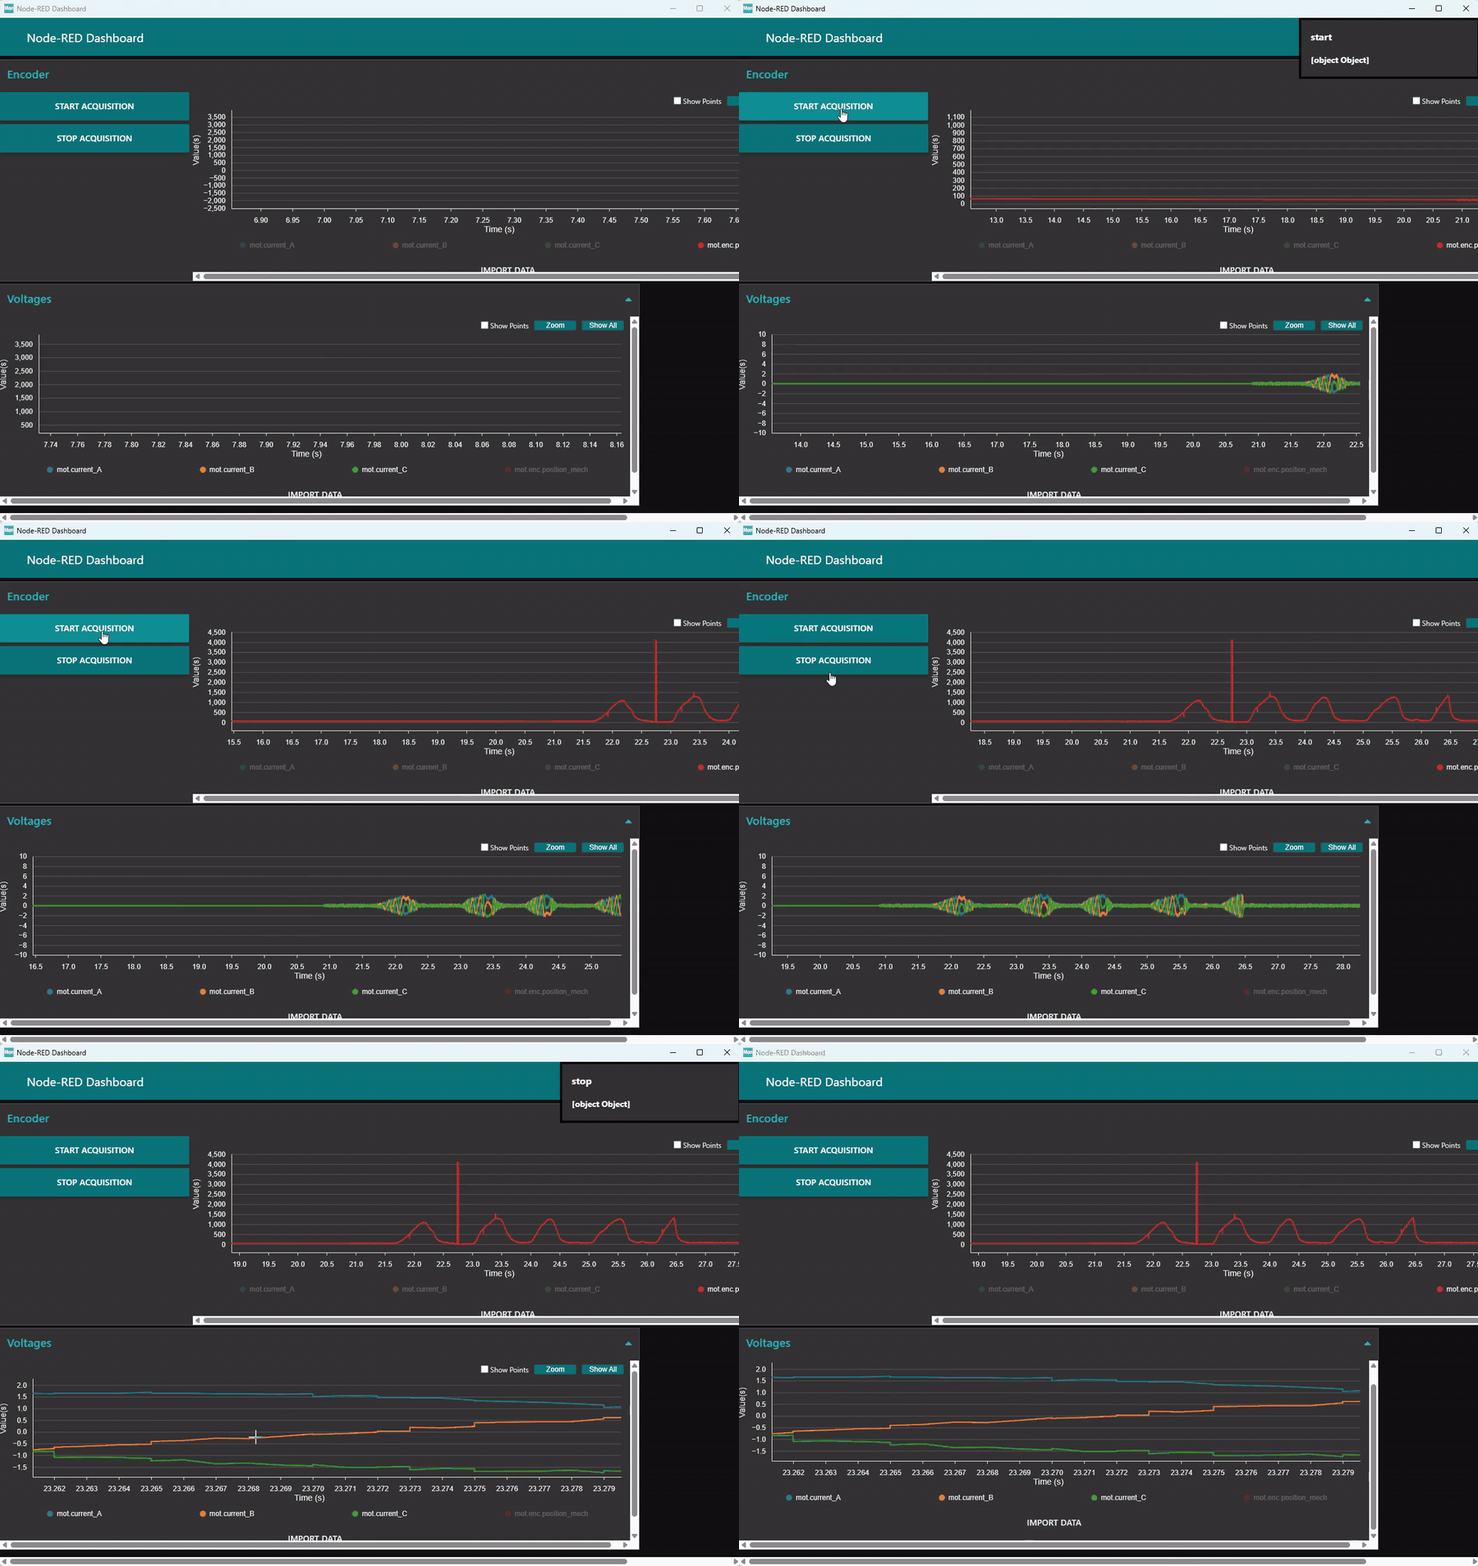
Where it shines: a free, cross-platform dashboard for STM32 - a panel for a test bench, a demo for a customer, a screen for a technician who will never open a debugger.
Where it gets in the way: it’s STM32 only, and every plot is a flow you build first. That’s a fair price for a dashboard you’ll use for months, and a high one when all you want is to look at three variables for five minutes. It’s a dashboard tool first, so the charts are made for watching values more than for measuring them, and there’s no SWO trace view. Very steep learning curve to get the first data out.
FreeMASTER
FreeMASTER is NXP’s run-time debugging tool, with a long history in NXP’s reference designs. Its main views are a variable watch grid, where you can also write values, an oscilloscope that polls variables from the PC and plots them in real time, and a recorder for fast signals: the firmware samples into a buffer on the target, at rates the link couldn’t sustain, and FreeMASTER uploads it after a trigger. Variables come from the ELF/DWARF debug information, or from TSA tables compiled into the firmware.
Its strongest point is the choice of connections. Over JTAG/SWD - it can read and write memory with no code on the target. Everything else - UART, USB, CAN, TCP/IP, SEGGER RTT, and the recorder over the debug port - goes through the FreeMASTER communication driver, which you add to the firmware from the MCUXpresso SDK. In return, you can reach a target that’s sealed in an enclosure or sitting on a CAN bus, where a debug probe will never be connected.
On top of that, FreeMASTER project pages can be HTML and JavaScript with gauges, sliders and buttons, and a JSON-RPC API lets Python, Node.js, C#, MATLAB or Excel drive it - handy for automated tests and custom tuning tools.
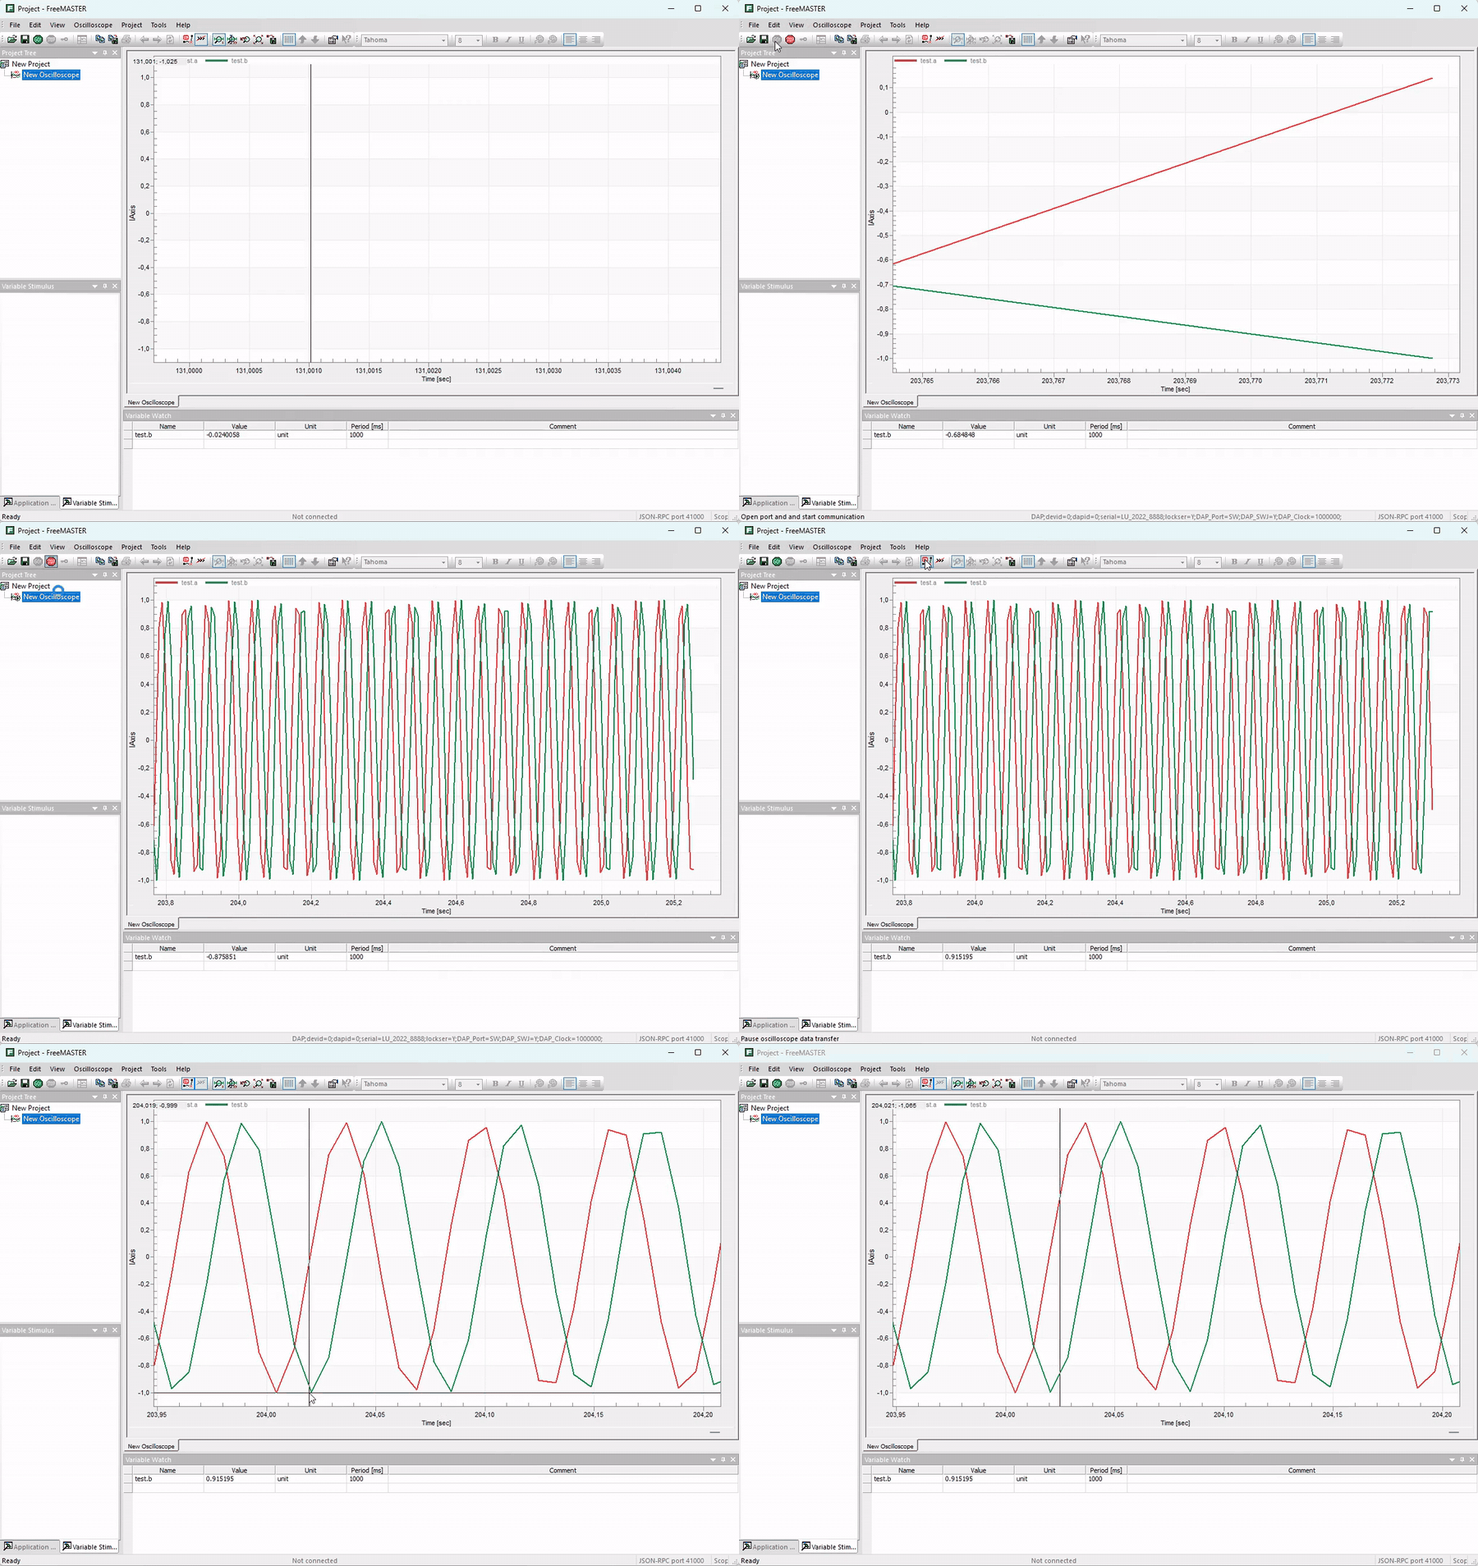
Where it shines: NXP projects and systems that have to be monitored over a field bus or a network rather than a debug probe.
Where it gets in the way: the license allows FreeMASTER and its communication driver only in systems based on NXP microcontrollers or processors - on an STM32 or an MSPM0 it’s not an option. The desktop application is Windows only; on Linux there’s FreeMASTER Lite, the communication service without the desktop user interface, and not every connection type is available there. Most of the advanced features need the driver integrated into the firmware first, and there’s no SWO trace view either.
MCUViewer
MCUViewer is built for debugging. You pick the *.elf file and the probe, drag variables onto plots and press start - the variable plotting tutorial goes from download to the first plot in about five minutes. It samples RAM over SWD while the core runs, and writes values back from the variable table, with no changes to the firmware.
The plots are made for measuring, not just watching. Stop the acquisition and use the cursors for time differences, frequency and slope, or open the statistics window for min, max, mean and standard deviation over a selected range. Fixed-point and enum variables are shown as values instead of raw integers, and any plot can be exported to CSV.
Next to the Variable Viewer there are two more ways to get data out of the target:
- Trace Viewer decodes SWO. A single ITM register write marks the start or the end of an interrupt, or sends a sample of a fast signal, and MCUViewer plots it with timestamps - interrupt duration and period, jitter, and signals the debug link couldn’t keep up with. It needs a Cortex-M3, M4, M7 or M33 core and an ST-Link or J-Link. The SWO plotting tutorial shows the whole setup.
- Recorder captures signals faster than the debug link - a current loop running at tens of kHz, for example - with a small module called from the interrupt, and triggers with pre-trigger samples like an oscilloscope. Because only the finished buffer is read, it works over slow or isolated links too.
ST-Link and J-Link are supported directly, including J-Link’s high-speed sampling mode, which reaches tens of kHz. Anything OpenOCD supports - CMSIS-DAP probes, the Raspberry Pi Debug Probe - works through a GDB server, and targets without a supported probe, such as TI C2000, connect over a UART with a small serial driver. It’s the same tool for an STM32 at work and an RP2040 at home, on Windows, Linux and macOS. A built-in MCP server also lets AI coding agents such as Claude Code or GitHub Copilot set up a project, start the acquisition and analyze the data.
Where it shines: finding out why something misbehaves - tuning a control loop on the plot, timing interrupts, capturing a glitch - on almost any Cortex-M or RISC-V target. More user friendly at the start, much better plot and variable manipulation. Supports all modern systems.
Where it gets in the way: it’s not a dashboard tool - there are no gauges, buttons or panels to hand over to an operator. There is currently no CAN bus support as there are many other good tools that do it better.
Which one to pick
| If you… | Pick |
|---|---|
| want to measure on the plot - rise time, overshoot, noise | MCUViewer |
| need a panel for a test bench, a demo or a technician, on STM32 | STM32CubeMonitor |
| work on NXP parts only and don’t mind the outdated UI | FreeMASTER |
| have to reach an NXP target over CAN or Ethernet | FreeMASTER |
| move between STM32, NXP and other targets, or between probes | MCUViewer |
| need interrupt timing or fast signals over SWO | MCUViewer |
| need a multiplatform solution with priority support | MCUViewer |